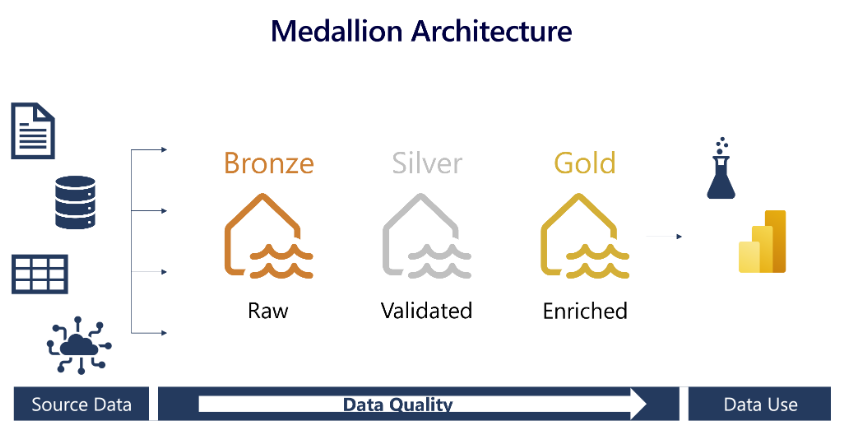
This blog outlines steps involved in building a medallion lakehouse architecture in a microsoft fabric lakehouse using notebooks.
1
2
3
4
5
* Create a Workspace
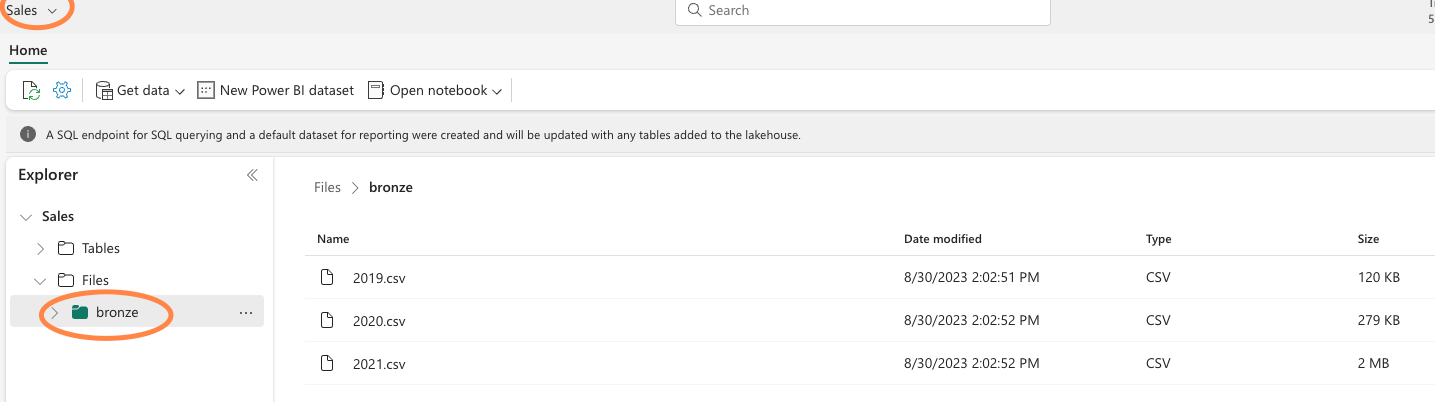
* Create a Lakehouse and upload data to the Bronze layer
* Transform the data and load it to the Silver Delta table
* Transform the data further and load it to the Gold Delta tables
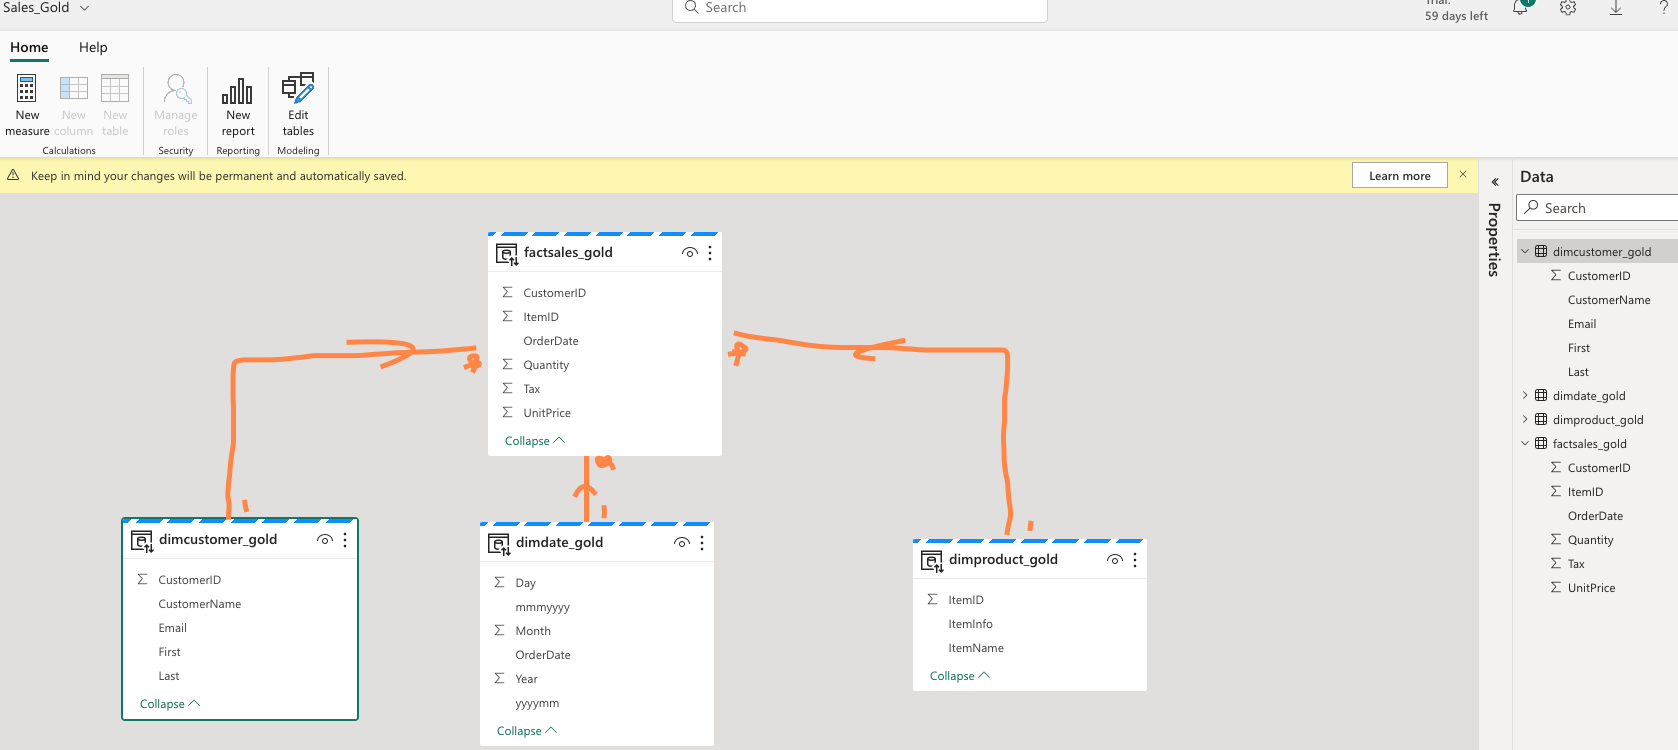
* Explore the dataset and create relationship in the form of Fact table and Dimension tables
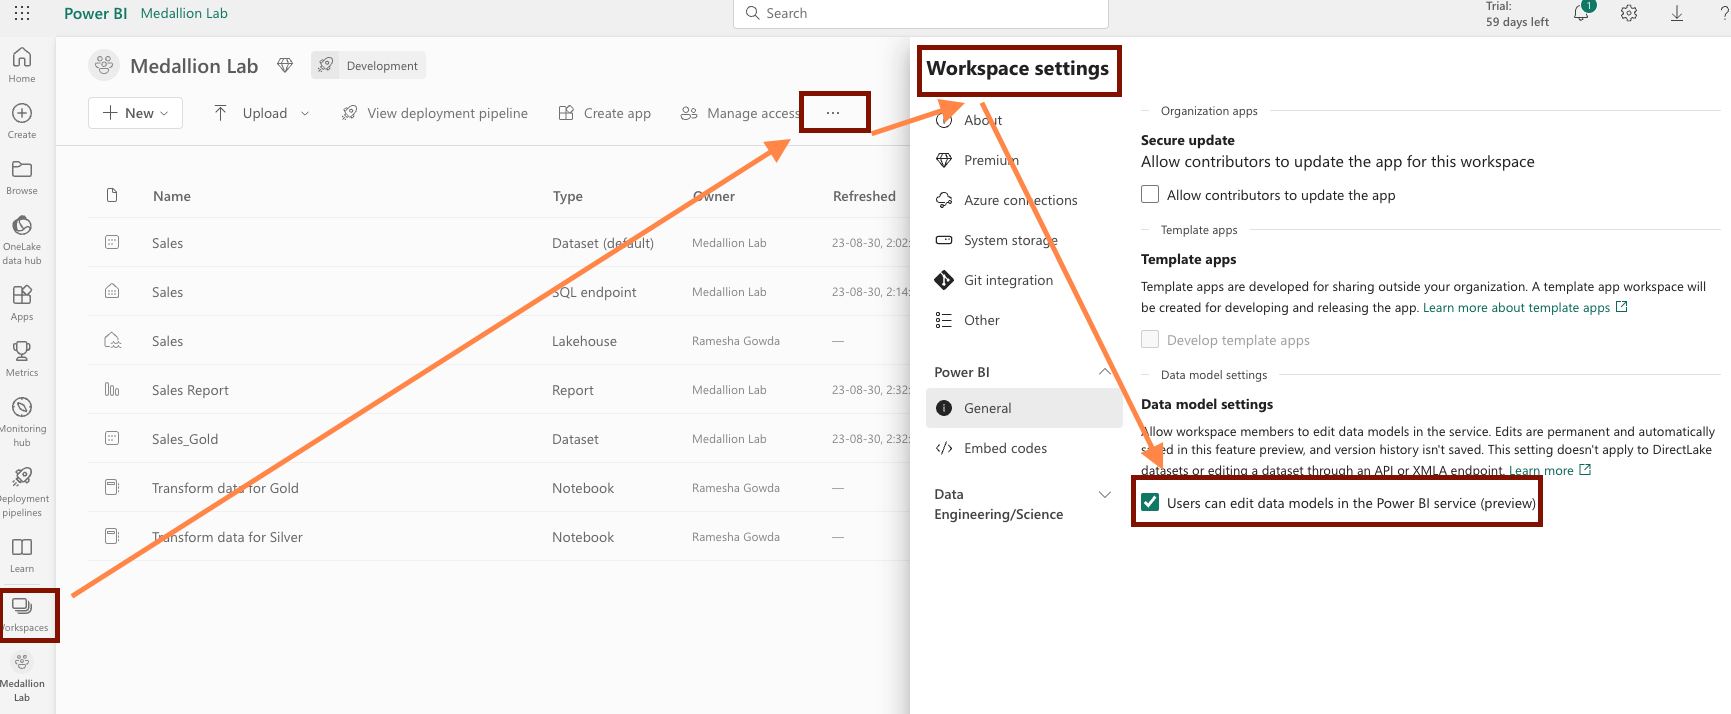
Login to MS Fabric and create new workspace ==> … ==> Workspace settings ==> enable “Data model settings”
Let us use a notebook to transform the data and load it to a delta table in the silver layer.
Execute the following code in each cell
1
2
3
4
5
6
7
8
9
10
11
12
13
14
15
16
17
18
19
20
21

    from pyspark.sql.types import *

# Create the schema for the table
orderSchema = StructType([
    StructField("SalesOrderNumber", StringType()),
    StructField("SalesOrderLineNumber", IntegerType()),
    StructField("OrderDate", DateType()),
    StructField("CustomerName", StringType()),
    StructField("Email", StringType()),
    StructField("Item", StringType()),
    StructField("Quantity", IntegerType()),
    StructField("UnitPrice", FloatType()),
    StructField("Tax", FloatType())
    ])

# Import all files from bronze folder of lakehouse
df = spark.read.format("csv").option("header", "true").schema(orderSchema).load("Files/bronze/*.csv")

# Display the first 10 rows of the dataframe to preview your data
display(df.head(10))
The code you ran loaded the data from the CSV files in the bronze folder into a Spark dataframe, and then displayed the first few rows of the dataframe.
Now you’ll add columns for data validation and cleanup, using a PySpark dataframe to add columns and update the values of some of the existing columns.
1
2
3
4
5
6
7
8
9
    from pyspark.sql.functions import when, lit, col, current_timestamp, input_file_name

    # Add columns IsFlagged, CreatedTS and ModifiedTS
    df = df.withColumn("FileName", input_file_name()) \
        .withColumn("IsFlagged", when(col("OrderDate") < '2019-08-01',True).otherwise(False)) \
        .withColumn("CreatedTS", current_timestamp()).withColumn("ModifiedTS", current_timestamp())

    # Update CustomerName to "Unknown" if CustomerName null or empty
    df = df.withColumn("CustomerName", when((col("CustomerName").isNull() | (col("CustomerName")=="")),lit("Unknown")).otherwise(col("CustomerName")))
Next, you’ll define the schema for the sales_silver table in the sales database using Delta Lake format.
1
2
3
4
5
6
7
8
9
10
11
12
13
14
15
16
17
18
19
20
21
    # Define the schema for the sales_silver table

    from pyspark.sql.types import *
    from delta.tables import *

    DeltaTable.createIfNotExists(spark) \
        .tableName("sales.sales_silver") \
        .addColumn("SalesOrderNumber", StringType()) \
        .addColumn("SalesOrderLineNumber", IntegerType()) \
        .addColumn("OrderDate", DateType()) \
        .addColumn("CustomerName", StringType()) \
        .addColumn("Email", StringType()) \
        .addColumn("Item", StringType()) \
        .addColumn("Quantity", IntegerType()) \
        .addColumn("UnitPrice", FloatType()) \
        .addColumn("Tax", FloatType()) \
        .addColumn("FileName", StringType()) \
        .addColumn("IsFlagged", BooleanType()) \
        .addColumn("CreatedTS", DateType()) \
        .addColumn("ModifiedTS", DateType()) \
        .execute()
Now you’re going to perform an upsert operation on a Delta table, updating existing records based on specific conditions and inserting new records when no match is found.
This operation is important because it enables you to update existing records in the table based on the values of specific columns, and insert new records when no match is found. This is a common requirement when you’re loading data from a source system that may contain updates to existing and new records.
1
2
3
4
5
6
7
8
9
10
11
12
13
14
15
16
17
18
19
20
21
22
23
24
25
26
27
28
29
30
31
32
33
34
35
36
    # Update existing records and insert new ones based on a condition defined by the columns SalesOrderNumber, OrderDate, CustomerName, and Item.

from delta.tables import *

deltaTable = DeltaTable.forPath(spark, 'Tables/sales_silver')

dfUpdates = df

deltaTable.alias('silver') \
.merge(
    dfUpdates.alias('updates'),
    'silver.SalesOrderNumber = updates.SalesOrderNumber and silver.OrderDate = updates.OrderDate and silver.CustomerName = updates.CustomerName and silver.Item = updates.Item'
) \
.whenMatchedUpdate(set =
    {

    }
) \
.whenNotMatchedInsert(values =
    {
    "SalesOrderNumber": "updates.SalesOrderNumber",
    "SalesOrderLineNumber": "updates.SalesOrderLineNumber",
    "OrderDate": "updates.OrderDate",
    "CustomerName": "updates.CustomerName",
    "Email": "updates.Email",
    "Item": "updates.Item",
    "Quantity": "updates.Quantity",
    "UnitPrice": "updates.UnitPrice",
    "Tax": "updates.Tax",
    "FileName": "updates.FileName",
    "IsFlagged": "updates.IsFlagged",
    "CreatedTS": "updates.CreatedTS",
    "ModifiedTS": "updates.ModifiedTS"
    }
) \
.execute()
You now have data in your silver delta table that is ready for further transformation and modeling.
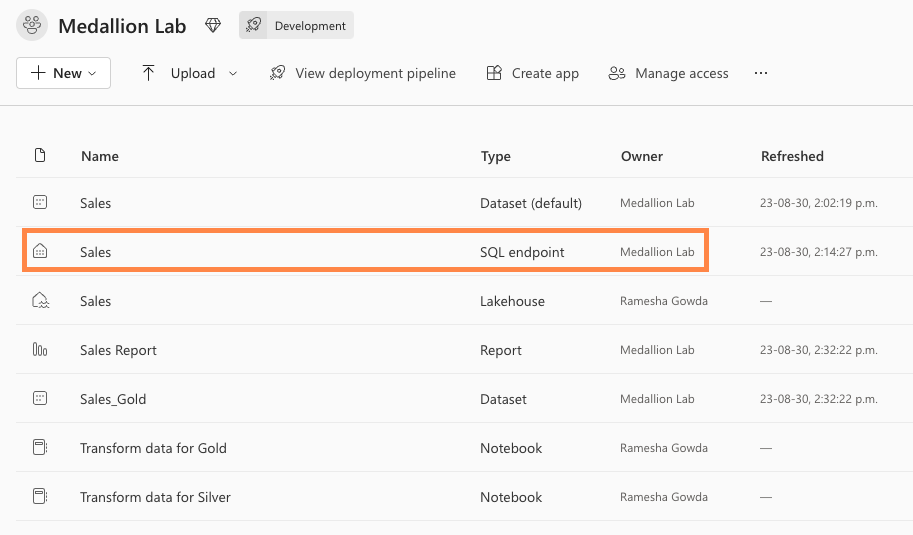
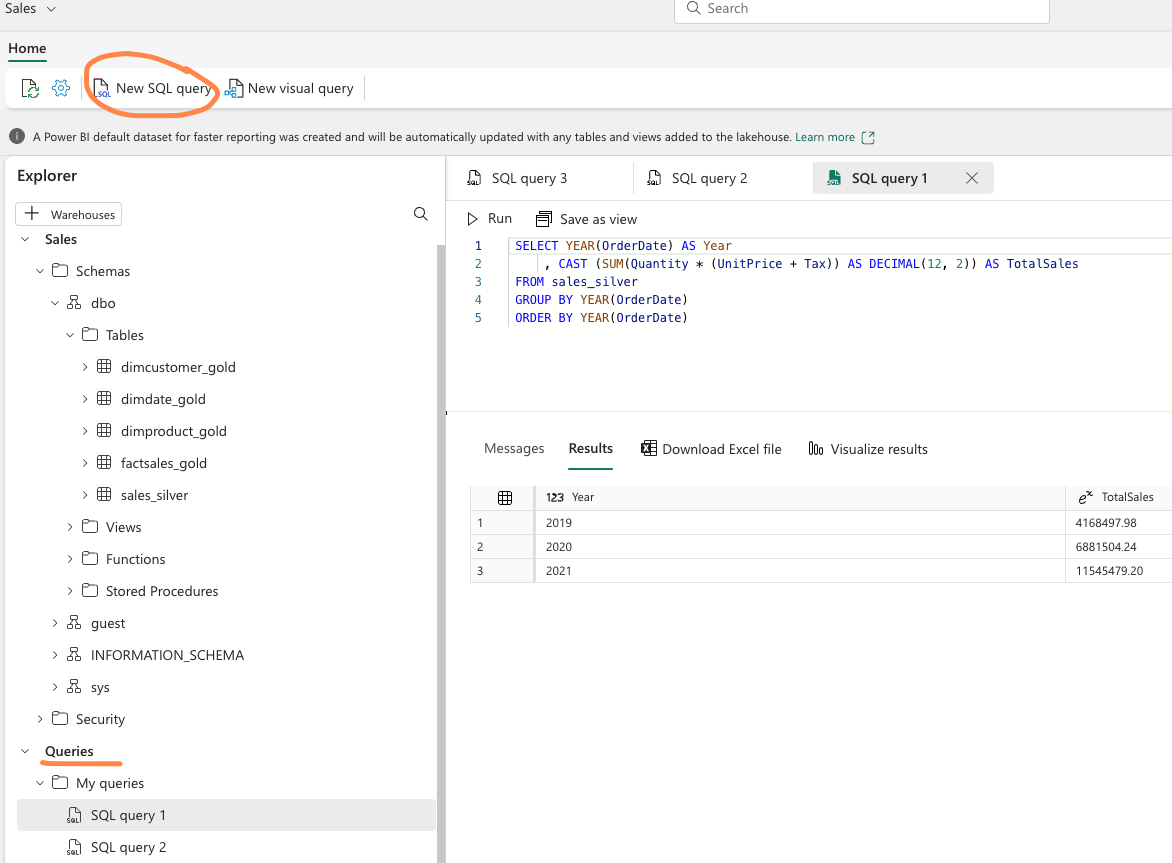
Now that you have data in your silver layer, you can use the SQL endpoint to explore the data and perform some basic analysis. This is a nice option for you if you’re familiar with SQL and want to do some basic exploration of your data. In this exercise we’re using the SQL endpoint view in Fabric, but note that you can also use other tools like SQL Server Management Studio (SSMS) and Azure Data Explorer.
You have successfully taken data from your bronze layer, transformed it, and loaded it into a silver Delta table. Now you’ll use a new notebook to transform the data further, model it into a star schema, and load it into gold Delta tables.
1
2
     # Load data to the dataframe as a starting point to create the gold layer
    df = spark.read.table("Sales.sales_silver")
Create Date dimension table
1
2
3
4
5
6
7
8
9
10
11
12
13
        from pyspark.sql.types import *
from delta.tables import*

    # Define the schema for the dimdate_gold table
    DeltaTable.createIfNotExists(spark) \
        .tableName("sales.dimdate_gold") \
        .addColumn("OrderDate", DateType()) \
        .addColumn("Day", IntegerType()) \
        .addColumn("Month", IntegerType()) \
        .addColumn("Year", IntegerType()) \
        .addColumn("mmmyyyy", StringType()) \
        .addColumn("yyyymm", StringType()) \
        .execute()
Create dataframe for Date dimension
1
2
3
4
5
6
7
8
9
10
11
12
13
14
15
    from pyspark.sql.functions import col, dayofmonth, month, year, date_format

# Create dataframe for dimDate_gold

dfdimDate_gold = df.dropDuplicates(["OrderDate"]).select(col("OrderDate"), \
        dayofmonth("OrderDate").alias("Day"), \
        month("OrderDate").alias("Month"), \
        year("OrderDate").alias("Year"), \
        date_format(col("OrderDate"), "MMM-yyyy").alias("mmmyyyy"), \
        date_format(col("OrderDate"), "yyyyMM").alias("yyyymm"), \
    ).orderBy("OrderDate")

# Display the first 10 rows of the dataframe to preview your data

display(dfdimDate_gold.head(10))
Update the date dimension as new data comes in
1
2
3
4
5
6
7
8
9
10
11
12
13
14
15
16
17
18
19
20
21
22
23
24
25
26
27
    from delta.tables import *

    deltaTable = DeltaTable.forPath(spark, 'Tables/dimdate_gold')

    dfUpdates = dfdimDate_gold

    deltaTable.alias('silver') \
    .merge(
        dfUpdates.alias('updates'),
        'silver.OrderDate = updates.OrderDate'
    ) \
    .whenMatchedUpdate(set =
        {

        }
    ) \
    .whenNotMatchedInsert(values =
        {
        "OrderDate": "updates.OrderDate",
        "Day": "updates.Day",
        "Month": "updates.Month",
        "Year": "updates.Year",
        "mmmyyyy": "updates.mmmyyyy",
        "yyyymm": "yyyymm"
        }
    ) \
    .execute()
Create your customer dimension
1
2
3
4
5
6
7
8
9
10
11
12
    from pyspark.sql.types import *
    from delta.tables import *

    # Create customer_gold dimension delta table
    DeltaTable.createIfNotExists(spark) \
        .tableName("sales.dimcustomer_gold") \
        .addColumn("CustomerName", StringType()) \
        .addColumn("Email",  StringType()) \
        .addColumn("First", StringType()) \
        .addColumn("Last", StringType()) \
        .addColumn("CustomerID", LongType()) \
        .execute()
Drop duplicate customers, select specific columns, and split the “CustomerName” column to create “First” and “Last” name columns:
1
2
3
4
5
6
7
8
9
10
11
    from pyspark.sql.functions import col, split

    # Create customer_gold dataframe

    dfdimCustomer_silver = df.dropDuplicates(["CustomerName","Email"]).select(col("CustomerName"),col("Email")) \
        .withColumn("First",split(col("CustomerName"), " ").getItem(0)) \
        .withColumn("Last",split(col("CustomerName"), " ").getItem(1))

    # Display the first 10 rows of the dataframe to preview your data

    display(dfdimDate_gold.head(10))
Create the ID column for our customers
1
2
3
4
5
6
7
8
9
10
11
12
13
    from pyspark.sql.functions import monotonically_increasing_id, col, when, coalesce, max, lit

    dfdimCustomer_temp = spark.read.table("Sales.dimCustomer_gold")

    MAXCustomerID = dfdimCustomer_temp.select(coalesce(max(col("CustomerID")),lit(0)).alias("MAXCustomerID")).first()[0]

    dfdimCustomer_gold = dfdimCustomer_silver.join(dfdimCustomer_temp,(dfdimCustomer_silver.CustomerName == dfdimCustomer_temp.CustomerName) & (dfdimCustomer_silver.Email == dfdimCustomer_temp.Email), "left_anti")

    dfdimCustomer_gold = dfdimCustomer_gold.withColumn("CustomerID",monotonically_increasing_id() + MAXCustomerID + 1)

    # Display the first 10 rows of the dataframe to preview your data

    display(dfdimDate_gold.head(10))
Ensure that your customer table remains up-to-date as new data comes in.
1
2
3
4
5
6
7
8
9
10
11
12
13
14
15
16
17
18
19
20
21
22
23
24
25
26
    from delta.tables import *

    deltaTable = DeltaTable.forPath(spark, 'Tables/dimcustomer_gold')

    dfUpdates = dfdimCustomer_gold

    deltaTable.alias('silver') \
    .merge(
        dfUpdates.alias('updates'),
        'silver.CustomerName = updates.CustomerName AND silver.Email = updates.Email'
    ) \
    .whenMatchedUpdate(set =
        {

        }
    ) \
    .whenNotMatchedInsert(values =
        {
        "CustomerName": "updates.CustomerName",
        "Email": "updates.Email",
        "First": "updates.First",
        "Last": "updates.Last",
        "CustomerID": "updates.CustomerID"
        }
    ) \
    .execute()
Repeat those steps to create your product dimension
1
2
3
4
5
6
7
8
9
    from pyspark.sql.types import *
    from delta.tables import *

    DeltaTable.createIfNotExists(spark) \
        .tableName("sales.dimproduct_gold") \
        .addColumn("ItemName", StringType()) \
        .addColumn("ItemID", LongType()) \
        .addColumn("ItemInfo", StringType()) \
        .execute()
1
2
3
4
5
6
7
8
9
10
11
    from pyspark.sql.functions import col, split, lit

    # Create Customer_gold dataframe, this dataframe will be used later on on the Sales join

    dfdimProduct_silver = df.dropDuplicates(["Item"]).select(col("Item")) \
        .withColumn("ItemName",split(col("Item"), ", ").getItem(0)) \
        .withColumn("ItemInfo",when((split(col("Item"), ", ").getItem(1).isNull() | (split(col("Item"), ", ").getItem(1)=="")),lit("")).otherwise(split(col("Item"), ", ").getItem(1)))

    # Display the first 10 rows of the dataframe to preview your data

    display(dfdimProduct_silver.head(10))
1
2
3
4
5
6
7
8
9
10
11
12
13
14
    from pyspark.sql.functions import monotonically_increasing_id, col, lit, max, coalesce

    #dfdimProduct_temp = dfdimProduct_silver
    dfdimProduct_temp = spark.read.table("Sales.dimProduct_gold")

    MAXProductID = dfdimProduct_temp.select(coalesce(max(col("ItemID")),lit(0)).alias("MAXItemID")).first()[0]

    dfdimProduct_gold = dfdimProduct_silver.join(dfdimProduct_temp,(dfdimProduct_silver.ItemName == dfdimProduct_temp.ItemName) & (dfdimProduct_silver.ItemInfo == dfdimProduct_temp.ItemInfo), "left_anti")

    dfdimProduct_gold = dfdimProduct_gold.withColumn("ItemID",monotonically_increasing_id() + MAXProductID + 1)

    # Display the first 10 rows of the dataframe to preview your data

    display(dfdimProduct_gold.head(10))
1
2
3
4
5
6
7
8
9
10
11
12
13
14
15
16
17
18
19
20
21
22
23
24
       from delta.tables import *

        deltaTable = DeltaTable.forPath(spark, 'Tables/dimproduct_gold')

        dfUpdates = dfdimProduct_gold

        deltaTable.alias('silver') \
        .merge(
                dfUpdates.alias('updates'),
                'silver.ItemName = updates.ItemName AND silver.ItemInfo = updates.ItemInfo'
                ) \
                .whenMatchedUpdate(set =
                {

                }
                ) \
                .whenNotMatchedInsert(values =
                {
                "ItemName": "updates.ItemName",
                "ItemInfo": "updates.ItemInfo",
                "ItemID": "updates.ItemID"
                }
                ) \
                .execute()
Now that dimensions built out, the final step is to create the fact table.
1
2
3
4
5
6
7
8
9
10
11
12
    from pyspark.sql.types import *
    from delta.tables import *

    DeltaTable.createIfNotExists(spark) \
        .tableName("sales.factsales_gold") \
        .addColumn("CustomerID", LongType()) \
        .addColumn("ItemID", LongType()) \
        .addColumn("OrderDate", DateType()) \
        .addColumn("Quantity", IntegerType()) \
        .addColumn("UnitPrice", FloatType()) \
        .addColumn("Tax", FloatType()) \
        .execute()
Create a new dataframe to combine sales data with customer and product information include customer ID, item ID, order date, quantity, unit price, and tax:
1
2
3
4
5
6
7
8
9
10
11
12
13
14
15
16
17
18
19
20
21
22
23
24
    from pyspark.sql.functions import col

    dfdimCustomer_temp = spark.read.table("Sales.dimCustomer_gold")
    dfdimProduct_temp = spark.read.table("Sales.dimProduct_gold")

    df = df.withColumn("ItemName",split(col("Item"), ", ").getItem(0)) \
        .withColumn("ItemInfo",when((split(col("Item"), ", ").getItem(1).isNull() | (split(col("Item"), ", ").getItem(1)=="")),lit("")).otherwise(split(col("Item"), ", ").getItem(1))) \


    # Create Sales_gold dataframe

    dffactSales_gold = df.alias("df1").join(dfdimCustomer_temp.alias("df2"),(df.CustomerName == dfdimCustomer_temp.CustomerName) & (df.Email == dfdimCustomer_temp.Email), "left") \
            .join(dfdimProduct_temp.alias("df3"),(df.ItemName == dfdimProduct_temp.ItemName) & (df.ItemInfo == dfdimProduct_temp.ItemInfo), "left") \
        .select(col("df2.CustomerID") \
            , col("df3.ItemID") \
            , col("df1.OrderDate") \
            , col("df1.Quantity") \
            , col("df1.UnitPrice") \
            , col("df1.Tax") \
        ).orderBy(col("df1.OrderDate"), col("df2.CustomerID"), col("df3.ItemID"))

    # Display the first 10 rows of the dataframe to preview your data

    display(dffactSales_gold.head(10))
Ensure that sales data remains up-to-date.
1
2
3
4
5
6
7
8
9
10
11
12
13
14
15
16
17
18
19
20
21
22
23
24
25
26
27
    from delta.tables import *

    deltaTable = DeltaTable.forPath(spark, 'Tables/factsales_gold')

    dfUpdates = dffactSales_gold

    deltaTable.alias('silver') \
    .merge(
        dfUpdates.alias('updates'),
        'silver.OrderDate = updates.OrderDate AND silver.CustomerID = updates.CustomerID AND silver.ItemID = updates.ItemID'
    ) \
    .whenMatchedUpdate(set =
        {

        }
    ) \
    .whenNotMatchedInsert(values =
        {
        "CustomerID": "updates.CustomerID",
        "ItemID": "updates.ItemID",
        "OrderDate": "updates.OrderDate",
        "Quantity": "updates.Quantity",
        "UnitPrice": "updates.UnitPrice",
        "Tax": "updates.Tax"
        }
    ) \
    .execute()
Here you’re using Delta Lake’s merge operation to synchronize and update the factsales_gold table with new sales data (dffactSales_gold). The operation compares the order date, customer ID, and item ID between the existing data (silver table) and the new data (updates DataFrame), updating matching records and inserting new records as needed.
You now have a curated, modeled gold layer that can be used for reporting and analysis.
In your workspace, you can now use the gold layer to create a report and analyze the data. You can access the dataset directly in your workspace to create relationships and measures for reporting.
Note that you can’t use the default dataset that is automatically created when you create a lakehouse. You must create a new dataset that includes the gold tables you created in this exercise, from the lakehouse explorer.
In your workspace, navigate to your Sales lakehouse ==> Select New Power BI dataset from the ribbon of the lakehouse explorer view ==> Select your transformed gold tables to include in your dataset and select Confirm.
Rename your dataset so that it’s easier to identify. Select the dataset name in the top left corner of the window. Rename the dataset to Sales_Gold.
From here, you or other members of your data team can create reports and dashboards based on the data in your lakehouse. These reports will be connected directly to the gold layer of your lakehouse, so they’ll always reflect the latest data.